A Study Based on the Bright and Colored Lunar Halo Phenomena from 16th to 17th October 1997
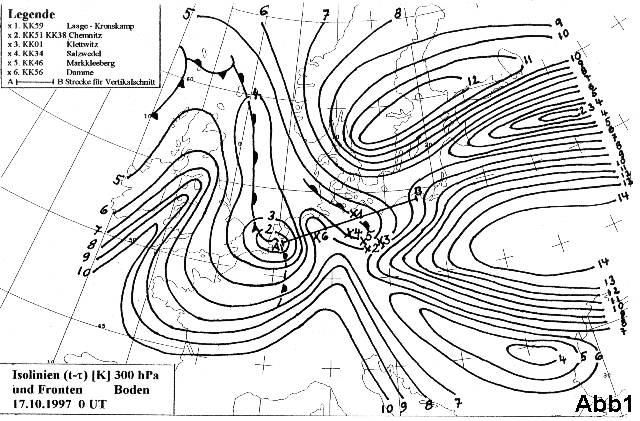
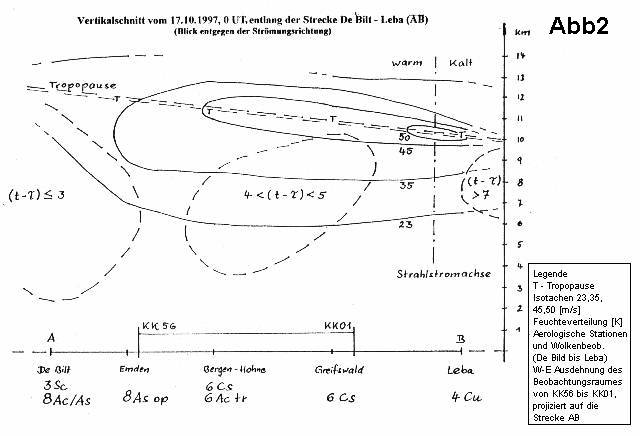
Due to the strongly meandering frontal zone, the general weather situation in Europe on October 16 and 17 was determined by several factors. An aged low over the eastern Atlantic had a controlling character in terms of frontal formation and development in our regions. This cyclone was developed up to the tropopause height and was characterized by a slight axial inclination. Over Eastern Europe, at the same time, there was a strong high-altitude trough with its axis extending from the North Cape to the eastern Mediterranean. The observation area of the observers KK34 to KK01 was on the warm side of the jet stream, so the warm front had to be assumed as the cause of the cirrostratus and not the characteristic cloudiness of the jet stream. This had a width of 1500 km, stretched from southern Norway to northern Italy, and had a vertical extent of about 8500 to 11500 m. To avoid overloading this contribution with additional state descriptions of the troposphere, all necessary data can be directly read in the two figures. Fig. 1 gives an overview of the moisture distribution (t-tau) at 300 hPa and the position of the fronts on the ground. The vertical section (Fig. 2) is schematic and contains only information that is important for the following considerations. For basic orientation, in Fig. 2, the east-west extension of the observation area from KK56 to KK01 was projected onto the A B line. The isotachs (lines of equal wind speed) were developed from the significant wind points of the radiosonde reports and show the warm side of the jet stream as a "flattened tube".
Unfortunately, I have no information about the frequency of colored moon halo phenomena. M. Minnaert writes about it: "...because they are significantly dimmer at the moon, and colors are almost unrecognizable". [1] There is also a note that moon halos have been seen in color several times. Since these may have been rare phenomena and sufficient data is available, some considerations on cloud physics will follow here. The occurrence of the halo types was due to the warm front, while the extraordinary brilliance of the phenomena was caused by the jet stream itself. The horizontal velocity shear could be neglected for our considerations. Throughout the entire altitude range of the jet, the vertical velocity shear (S) was significant. If we look at the height interval 6000 </= h </= 9500 m, S was still small. Only at an altitude h >/= 9500 m did S continuously increase. Since the wind direction changed only slightly, one can speak of a laminar flow in the height interval 6000 </= h </=9500 m. This means that in this interval, the hexagonal symmetric ice particles were preferably aligned horizontally and also directionally oriented (320° - 130°). The wind direction varied in the entire observation area and pressure interval 200 </= P </= 500 hPa by +-10°. From a cloud physics perspective, the ice particles moved with the laminar flow, with vortices that formed at the edges of the crystals being sufficiently small compared to the flow. Even collisions between ice crystals of different types would likely have caused little change in the preferential orientation. According to A. Macke, the scattering function and polarization in horizontal orientation depend on the illumination and observation geometry. "While scattering by randomly oriented hexagonal crystals only offers the observer concentric halo rings around the forward scattering direction, horizontally oriented crystals cause a variety of point and ring-shaped scattering maxima." [2]. If we now consider the structure of the ice particles, in the defined height interval the lower area (up to 6500 m) was occupied by hexagonal ice plates at t >/= -25°C. Hexagonal symmetrical columns only appeared from h >/= 6500m (t<-25°C) onwards. From an altitude of h >/= 9500 m, stronger turbulence was also likely due to the greater shear, so that oscillating, horizontally oriented hexagonal columns increasingly had to be reckoned with. All these particles with their orientations were indirectly evidenced by the observation. If we consider the observation results according to Table 1, a north-south division is recognizable. The 22° ring (formation by randomly oriented columns) and the upper contact arc (horizontally oriented columns) were bright in the north and weakly pronounced in the south. The sundogs, on the other hand, reached their greatest brightness in the south. The transition area might have been at KK34. Tab.1 and Fig.1 show that in 300 hPa, the south was significantly drier. Since the temperature in the E-W extension from KK56 to KK01 was in the interval -48 </= t </= -44°C of the 300 hPa surface, it is likely that with a dew point difference of 5 </= (t-tau)=6K, the concentration of columns in P=300 hPa of the observation area from KK01, KK38, and KK51 was considerably lower than in the north. A large part of the columns transported southward by the jet stream could have already sunk into lower layers earlier. In the 500 hPa surface, it was already quite warm at -20 to -17°C. According to Malberg [3], in the temperature interval -20 </= t </= -13°C, supercooled water droplets and ice crystals occur equally frequently, so that the columns probably changed their geometric form during the sinking. The southern area was very dry in the interval 600 </= P </= 850 hPa, so the light was barely attenuated. The entire layer of frontal cloud cover at KK59 was considerably thicker. The sundogs therefore only reached H=2. The data from KK56 do not fit into this picture because KK56 was no longer in the jet stream area and was already under the influence of another front system. This interpretation can naturally not answer all questions and is problematic in some points. This consideration is designed in terms of a state description. Clouds and fronts are in constant change and therefore represent processes rather than states. Another problem is the influence of locally acting factors, which are not determinable aerologically and synoptically. However, these can have a decisive influence on the visibility of halo phenomena if they change, for example, the illumination and/or observation geometry. Since the meteorological initial conditions were clearly determinable (warm front in the jet stream area) and these were stable over a longer period, such a consideration only makes sense then. In this way, it is possible to gradually collect data that can be useful for later analyses and projects.
Part 2
1. Introduction
In the evaluation of the events from 16.10.1997, it quickly became clear that one could have easily written several pages on this issue. Since conditions were already extensively characterized through observations and a brief interpretation based on synoptic and aerological data, I completely omitted explanations in Part 1. It was only later that it became evident that some explanations are indispensable for understanding the connections. In this part, the interpretation already undertaken will be reviewed with a simulation using HALOET and some considerations will be explained in more detail.
2. Preliminary Considerations
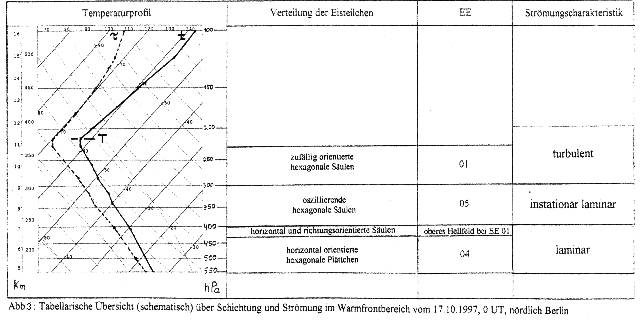
The synoptic provides the meteorological base data and the halo observation contributes valuable supplementary data. Based on this data, it is decided whether cloud-physical considerations are possible at all. In this case, it is front-bound Cs. The ice particles thus formed on-site through overrunning processes. This eliminates the difficult determination of the starting points of the trajectories of the particles to be observed. Fig. 3 provides a general overview of the state of the troposphere in the warm front area from 17.10., 0 UT and applies only to the northern region. The discussion here concerns the appearance of the parhelia, the upper tangent arc, and the 22° ring related to the observation area V from KK59, which was observed on 16.10. from 19.02 CET. The temperature profile made it possible to assign the different types of ice particles within the entire layer, as it is empirically fairly well known at which temperatures columns and plates occur. The dew point difference (t-tau) provided an indication of the concentrations of hexagonal cloud elements in the corresponding layer. The orientation of these particles was determined exclusively by the jet stream. The flow characteristics were determined according to different criteria and refer to the corresponding volume element dV of the observation area V. Although the flow of the troposphere generally tends to turbulence [4], under certain conditions laminar flows can also develop. Considering Fig. 3 alongside the distribution of ice particles and the flow characteristics, four layers emerge with different optical properties. In the first layer, the laminar flow dominated. The increase in speed was 5 m/s over 2.5 km. The velocity components v and w were not measurable, so the problem reduced to simple shear flow [5] in terms of order of magnitude. Since the kinematic viscosity of the air is low, small-scale turbulence had to be assumed anyway. However, in this case, the differential velocities relative to the flow were sufficiently small, so these possible turbulences could not cause a change in the preferential orientation of the plates. Mixing could not set in as the stratification was moisture-stable. Larger fluctuations in air density were also absent, as no inversions were detected in this layer. The assumption of horizontally oriented columns resulted from the temperature (t < -25°C) and the laminar flow, so in the second layer, the columns were distinctly oriented in their direction. In the third layer, the laminar flow became increasingly unsteady due to measurable fluctuations in the high wind field and air density, causing the predominantly horizontally oriented columns to oscillate with increasing amplitude. Above 300 hPa, the fluctuations were already so large that despite the increasing wind speed, the horizontal transitioned into a random orientation and the unsteady laminar flow turned into a turbulent one. The observed halo phenomena can now be assigned to these layers of frontal cirrus.
3. Simulation and Discussion
At this point, it is not about the simulation of the relationship appearance - particle, but about a test of the modeled optical properties of Cs. According to A. Macke, multiple scattering is suitable for investigating the optical properties of cirrus clouds [2]. The goal was to obtain a scattering pattern (Fig. 4) based on the modeled state that should match the observation under the conditions of multiple scattering. Since cloud physics considerations based on aerological measurement technology are only conditionally possible, and thus in some points the modeling had to be supported by theoretical considerations, an analysis of the ray path will be omitted here.
Since the frontal cloud cover was greater in vertical extension than in horizontal, I set the elevation a little higher at 10°, so that the light had to travel a longer distance through the cloud. At the beginning, each optical layer was simulated separately and the parameters tested. For determining boundary and edge values, the precise data from G. Busch and B. Kunitz on the variation of individual phenomena were indispensable. Fig. 4 shows the result of the simulation with all layers, and the table provides information about the parameters. Since the parameter file from HALOET only allows specification of the total layer thickness, the thickness of each layer was determined via the relative portions (portion) of crystal types and orientations. The relative portions result from the concentrations of crystal types in the corresponding layer, which are a function of (t-tau).
The scattering pattern (Fig. 4) immediately shows the scattering maxima for the paraselenae and the upper tangent arc. The small ring stands out due to a different distribution of pixels outside the ring compared to inside the ring. Brightness is greater outside the ring than inside, which also matches the observation well. According to the records about the variations of the 22° ring from that day, the differences in surface brightness were at times unusually large. Expressed in grayscale, it was dark white to light gray outside the ring at times, while inside it could be observed as dark gray to black, even in bright moonlight. The scattering maximum of the horizontally oriented columns is not recognizable, as it is overlaid by the upper tangent arc and the 22° ring. This glow above the small ring was also not seen. It was only recognizable in the single simulation.
Oscillating plates can also cause a small ring if the tilt angle is sufficiently large. A simulation by E. Tränkle [6] shows that it can also occur under certain conditions through rotating plates in connection with Lowitz arcs. However, the flow conditions on October 16 did not allow for such an emergence variant. In my opinion, no Lowitz arcs were observed during this period either. G. Busch observed a 46° ring (incomplete) and C. Hetze could recognize a Parry arc, which also supports the theory described above.
4. Problems
It is in the nature of things that some problems also arose during these considerations. The greatest difficulties were in determining the layers according to hydrodynamic criteria. Since the transitions to other flow properties are continuous, the greatest uncertainties arise here. If the individual layer thicknesses are determined according to other criteria, they may vary among themselves but do not result in a qualitatively different picture within the total layer. Due to the limited measurement accuracy of the radiosondes, cloud physical considerations are only possible to a limited extent, and these must then be carried out with the greatest caution. Considering that the geometric parameters of the ice crystals are approximately in the mm range, additional problems of model adaptation arise here. The HALOET program is obviously designed for the simulation of solar halo phenomena. Reflected light has somewhat different optical properties. I tried to compensate for this circumstance by refraining from optimizing the parameters, so that the scattering maxima were created under challenging conditions, so to speak.
5. Preliminary Result
Cirrus clouds located in the influence of strong wind fields and/or jet streams have, under certain conditions, significantly better optical properties than clouds located in low-wind areas. However, the optical properties are only improved if the flow leads to optimal spatial orientations of the ice crystals, which then also cause the corresponding halo phenomena. The ice particles must also be present in sufficient concentration.
6. Outlook
Now it depends on substantiating this result through a series of observations. If this result is confirmed in the future, an important consequence arises for the observation of halos. The better optical properties of ice clouds in jet streams and/or strong wind fields then enable the observation of phenomena that are hardly or only difficult to observe under normal circumstances due to their low brightness. Since the jets are stable over a longer period, one would theoretically have enough time to prepare such observations. Should the necessity arise in the future for the modeling of halo phenomena based on hydrodynamic, thermodynamic and optical aspects, then in any case, information on the variations of the individual phenomena is important.
Literature
[1] Marcel Minnaert, "Light and Color in Nature", Birkhäuser Verlag 1992, p. 263.
[2] Andreas Macke, "Modeling the Optical Properties of Cirrus Clouds", Dissertation, Hamburg 1994, p. 61.
[3] Horst Malberg, "Meteorology and Climatology", An Introduction, 2nd revised edition, Springer-Verlag 1994.
[4] England, Ulbricht, "Aviation Meteorology", Transpress VEB Verlag für Verkehrswesen, Berlin 1980, p. 239-244
[5] Sturk, "Fluid Mechanics - Introduction to the Theory of Flows", Springer Verlag, 4th edition, 1996, p. 152-207
[6] Tränkle, "Computer Simulation for the Detection of Lowitz Arcs", MM21, 1996, p. 70-71
| KK | Beobachter |
| KK56 | L. Ihlendorf, Damme (Niedersachsen) |
| KK34 | U. Sperberg, Salzwedel (Sachsen Anhalt) |
| KK59/10 | B. Kunitz, Laage Kronskamp (Mecklenburg-Vorp.) |
| KK59/04 | G. Busch, Kritzkow (Mecklenburg-Vorpommern) |
| KK46 | R. Winkler, Markkleeberg (Sachsen) |
| KK51 | C. Hetze, Chemnitz, (Sachsen) |
| KK38 | W. Hinz, Chemnitz (Sachsen) |
| KK01 | R. Löwenherz, Klettwitz (Brandenburg) |
by Rainer Schmidt, Laage Kronskamp


